 |
| Welcome |
| Downloads |
| ToscanaJ |
| Screenshots |
| Elba |
| Screenshots |
| Siena |
| Screenshots |
| Participate |
ToscanaJ: Screenshots
Click on one of the screenshots below for the full-size image:
A simple line diagram with one label showing the list of attached objects, the others only the counts:

Nested diagrams can be large, useful esp. if you want to export SVG or print:

The labels can contain arbitrary SQL like combination of aggregates (MIN and MAX in the example):

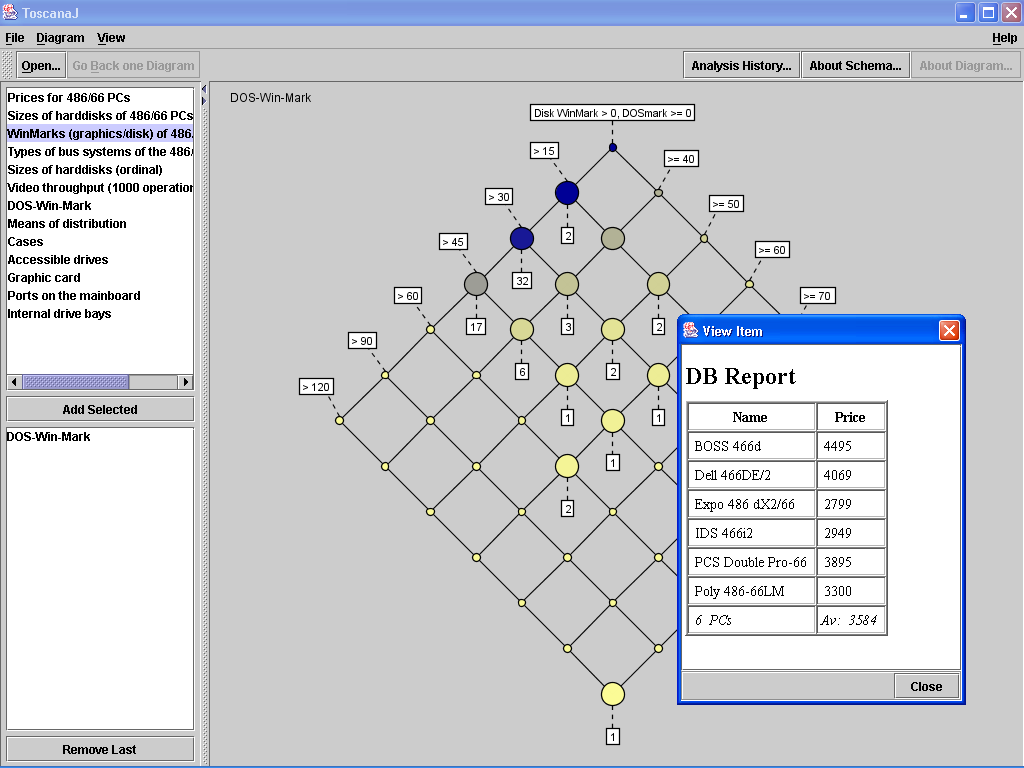
From the object labels additional database views can be opened, here a very simple HTML report:

This database view is a little more fancy. Note that the API for writing DB viewers is one method and the viewers are loaded
dynamically, i.e. you can easily write your own and plug them into ToscanaJ:

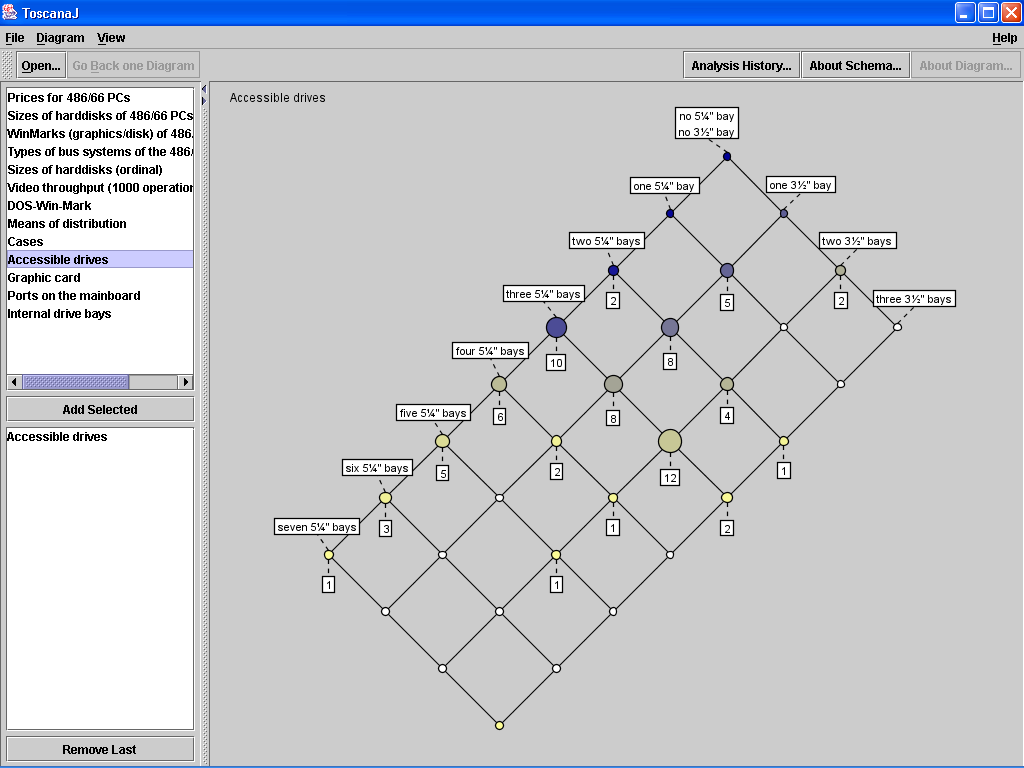
ToscanaJ can show diagrams in different ways. The user interface is spartanic to reduce complexity for the normal user, but
by changing some options in a text file you can change colors or get additional information into the diagrams like mapping
contingent sizes to the radii:

